Business Process Optimisation
Joining three years of fragmented procurement-to-delivery records revealed exactly where a fulfilment bottleneck was really hiding.
Client
Faragir Sanat Mehrbin
Role
Data Analyst
Deliverables
SQLite data model + Python analysis & visual report
109d pre-order delay
~129d total fulfilment
~37% gross margin steady
+6–9% on-time delivery
Faragir Sanat Mehrbin’s fulfilment times had crept upward and nobody could say exactly why — was it the suppliers, the warehouse, or the delivery partners? Three years of procurement, order, dispatch and delivery data existed, but only as separate systems that were never joined together, so nobody could see the process as a single timeline.
Joining four disconnected systems
The first real work was mechanical: reconciling procurement, order, dispatch and delivery records that used inconsistent date formats and identifiers, into one unified per-order timeline in SQLite.
Looking at stage durations, not totals
Once the timeline existed, the analysis focused specifically on the duration between each stage rather than the end-to-end total, which is what revealed that one stage was disproportionately responsible for the delay.
Boxplots over averages
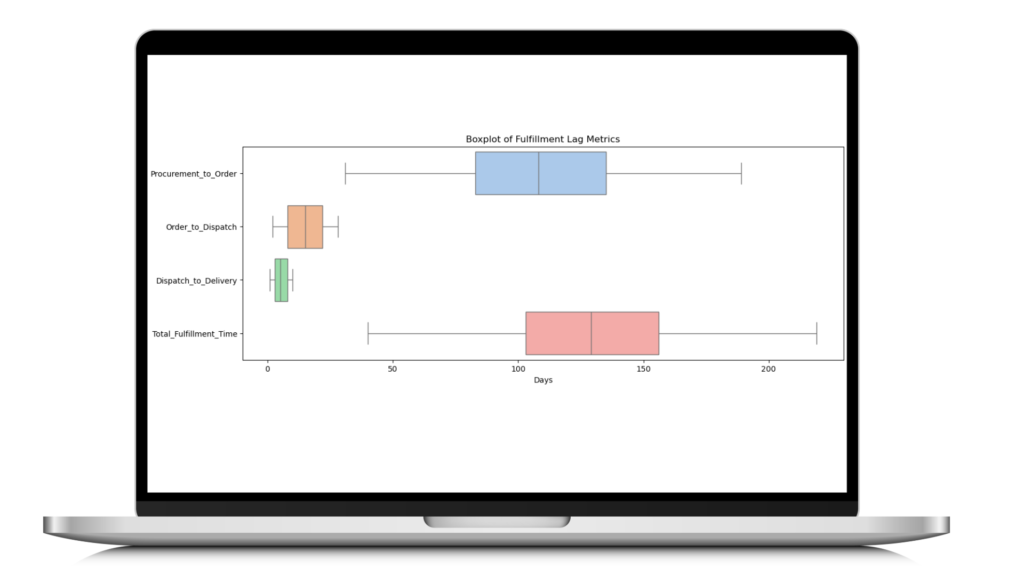
Visualising the full distribution of each stage’s duration (via Seaborn) rather than just an average exposed both the scale of the problem and the outliers dragging up the mean, which a single summary statistic would have hidden.
Checking margin before recommending speed fixes
Before proposing changes, gross margin was checked against slower vs faster orders to rule out that delays were somehow being offset by discount drift — they weren’t; margin held steady at roughly 37%.
Results
- Root cause isolated to a ~109-day average pre-order delay, not dispatch or delivery
- On-time delivery improved by 6–9% with gross margin held steady at ~37%
- Total fulfilment time pulled down from roughly 129 days, with the bottleneck localised to a few product lines rather than a single branch
Reflections
The most useful output of this project wasn’t a dashboard, it was a diagnosis. Everyone assumed the problem was logistics; the data showed it was upstream, in procurement lead time. That reframe changed what the business actually fixed.
Find the bottleneck before fixing anything
The instinct was to speed up delivery, but the data showed the real problem sat much earlier in the chain, before delivery was even involved.
One unified timeline, not four disconnected systems
Procurement, ordering, dispatch and delivery were tracked separately; joining them into a single stage-by-stage timeline was what made the bottleneck visible at all.
Check the finance side before recommending changes
Any fix that speeds up fulfilment but erodes margin isn't really a fix, so gross margin was checked against the slower orders before recommending anything.
Joining three years of fragmented records
Procurement, order, dispatch and delivery tables were joined in SQLite across three years of history, with dates fixed, duplicates removed and keys standardised so every order could be tracked stage-by-stage.
Measuring stage-to-stage duration
Rather than looking at total fulfilment time alone, the time between each individual stage was computed, which is what isolated exactly where the delay was accumulating.
Visualising the distribution, not just the average
Seaborn boxplots of each stage (Procurement→Order, Order→Dispatch, Dispatch→Delivery, Total Fulfilment) showed the spread and outliers, not just a misleading single average number.
Sanity-checking against margin
Gross margin was checked across faster and slower orders to confirm the bottleneck wasn't being masked by discounting on delayed orders.
Turning the finding into a playbook
The root cause (a roughly 109-day average pre-order delay) was translated into concrete operational fixes: faster internal sign-offs, firmer supplier dates, and small buffers on the slowest SKUs.
Interested in a similar engagement? Get in touch — I'm available for new SEO and analytics projects.