Real projects, not mockups
Data & Marketing Analytics
Turning scattered data into dashboards people actually use — Power BI, Looker Studio, and GA4 reporting, backed by Python and SQL.
Book a callReal projects, not mockups
Most businesses aren't short on data — they're short on data organised into something a decision-maker can actually use. Traffic lives in GA4, ad spend lives in three different platforms, and conversion data lives in a CRM that doesn't talk to any of them. The result is reporting that takes hours to assemble and is often out of date by the time it's presented.
As a marketing analytics consultant, the fix isn't more dashboards — it's fewer, better ones, built around the handful of metrics that actually drive a decision. That's the gap between a data visualization consultant who makes a chart look good and one who makes it answer a real question.
I led the web analytics workstream within Aston University's AI initiative, developing new tools and improving how web analytics data was collected and used across the organisation. That's the same scale-up in reverse that most businesses need — proper tracking and tooling applied at a size where getting it wrong is expensive, then brought to a business that just needs it done right the first time.
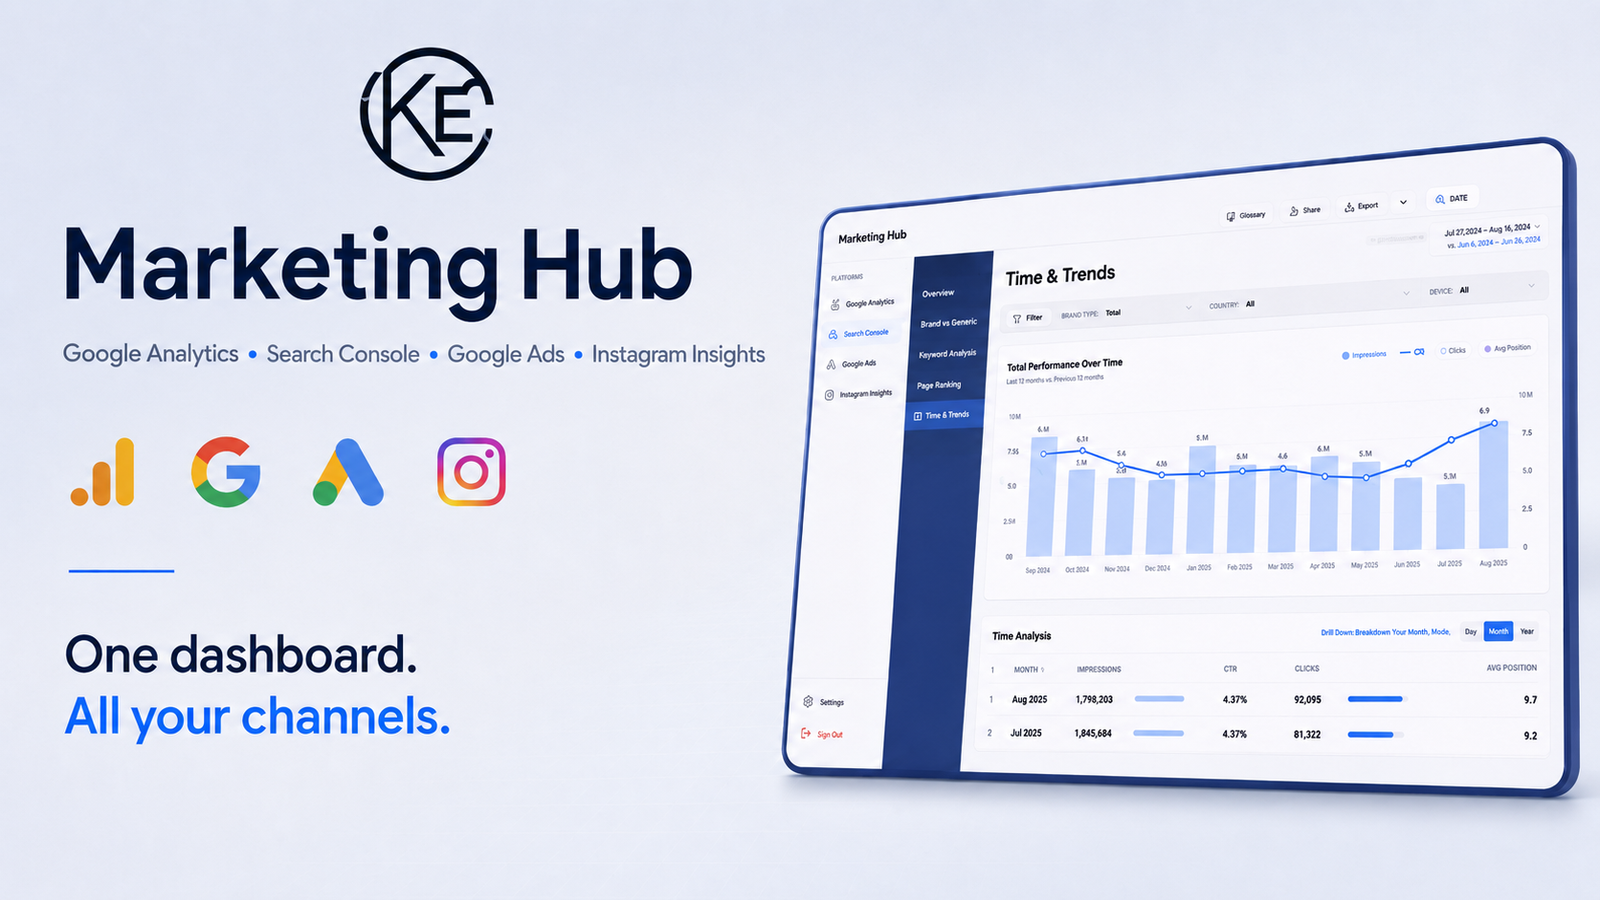
Consolidated Power BI dashboards pulling from multiple sources into a single live view, replacing manual spreadsheet exports with something that updates itself.
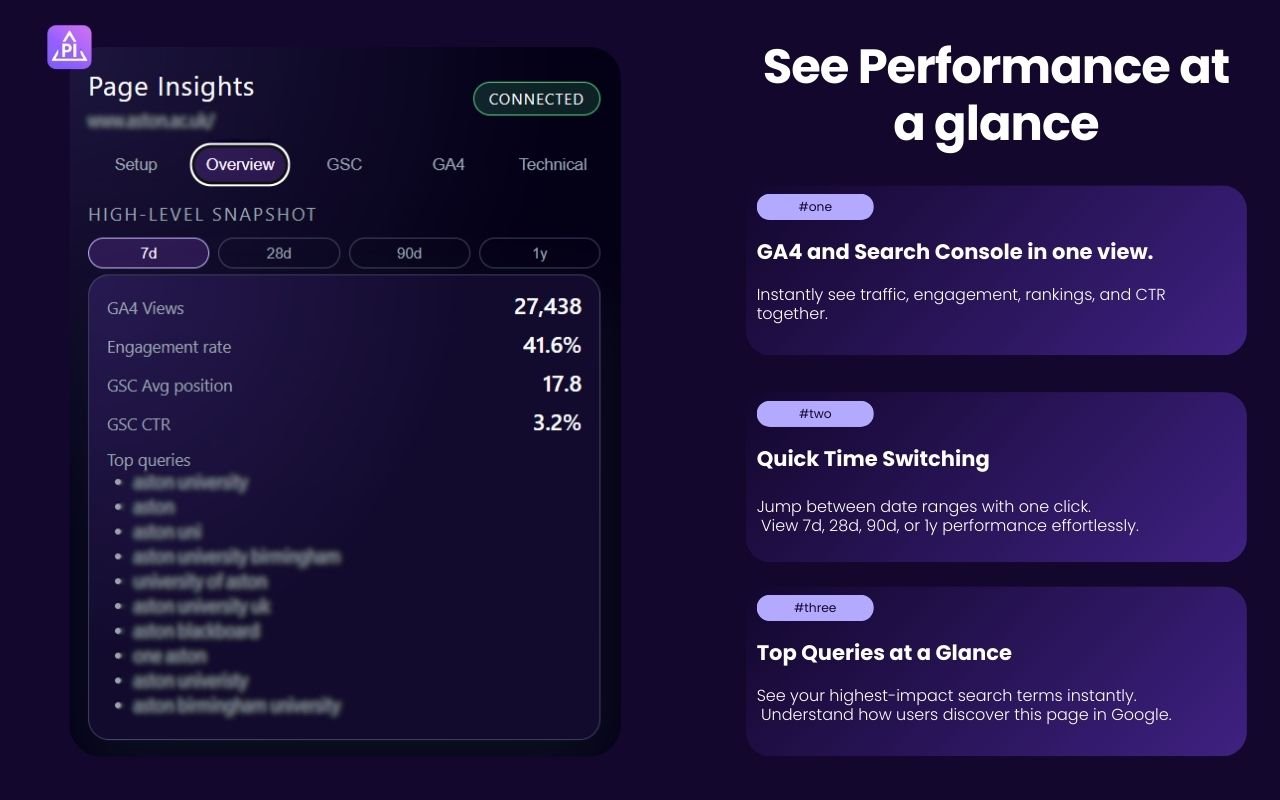
Marketing and web analytics reporting connected directly to GA4 and ad platforms, built for stakeholders who need a clear view without learning a new tool.
As a Google Analytics consultant, I configure event and conversion tracking correctly from the start — the foundation every dashboard depends on, and the most commonly broken part of a typical marketing stack.
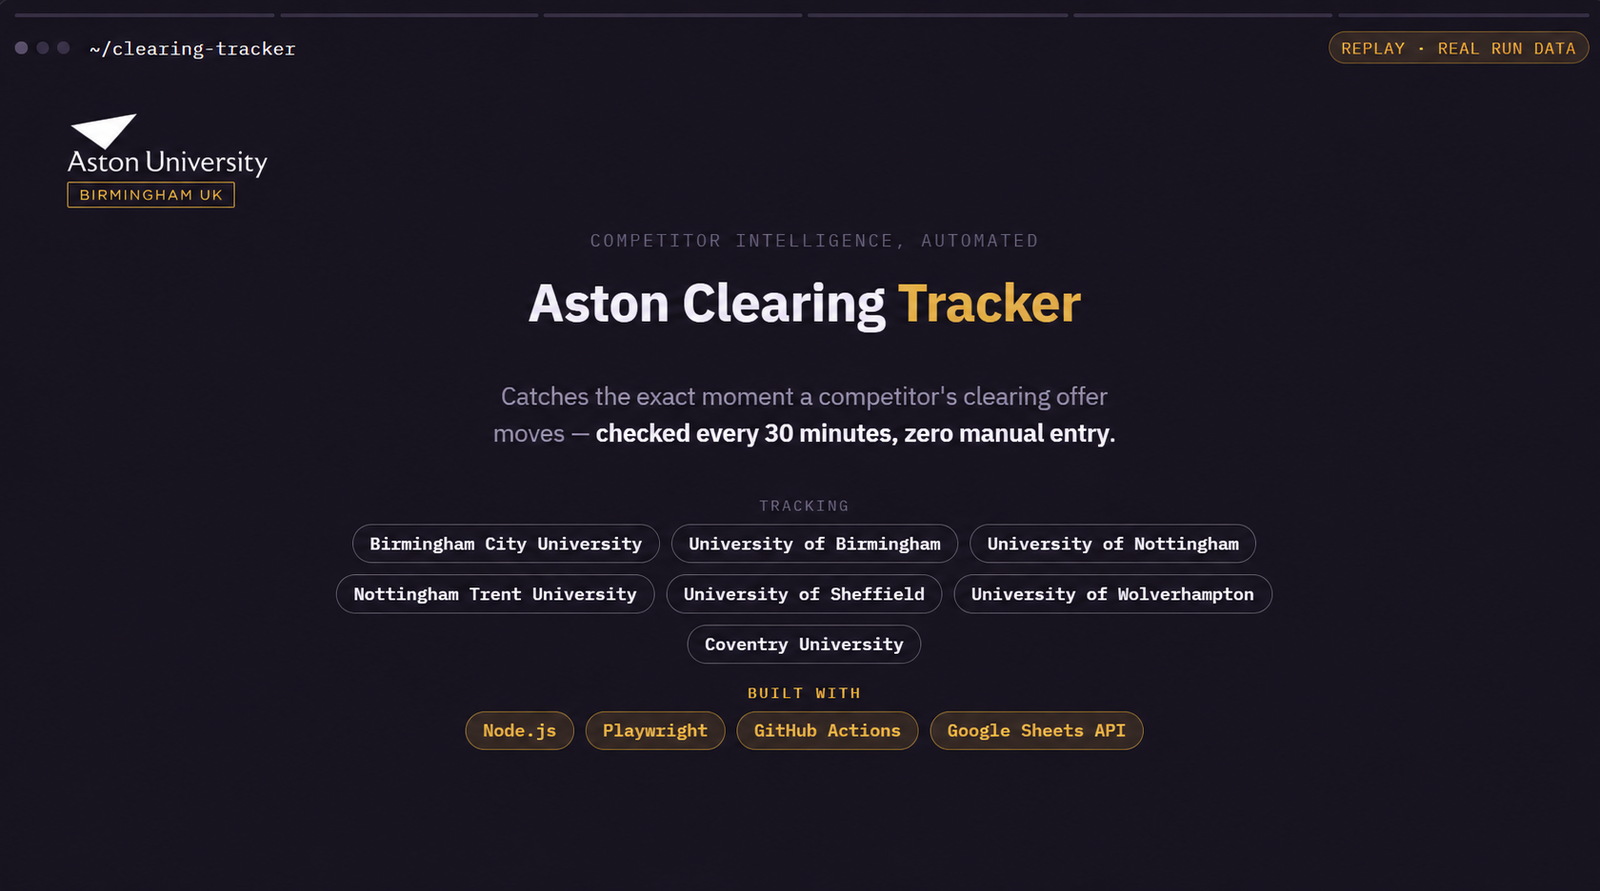
Python and SQL for work beyond what a standard dashboard connector supports — competitor tracking, custom pipelines, cross-dataset analysis.
Tools used
 Power BI
 Looker Studio
 Python
 SQL
SQL
 GA4
GA4
As a web analytics consultant I hold certifications in Data Visualization in Power BI, Analyzing Business Data in SQL, Business Analytics with Excel, and Google Analytics.
Reviewing what data sources exist, what's already tracked, and where tracking is broken or missing.
Identifying the specific metrics that drive real decisions, not everything that's technically trackable.
Setting up tracking and building the dashboard in Power BI, Looker Studio, or a custom solution.
Making the dashboard something you can read and use independently, not a black box only I can interpret.

“Highly recommended. He understood my wishes and implemented them exactly the way I wanted.”
Cees Bruil
It depends on your stack. Power BI suits businesses already in the Microsoft ecosystem; Looker Studio is often simpler for teams working primarily from Google Analytics and Ads data.
Both — a lot of projects start with discovering gaps in the underlying GA4 or Tag Manager setup, which gets fixed as part of the project.
The core skills — data consolidation, dashboard building, custom analysis with Python and SQL — apply beyond marketing. If you have operational or sales data needing the same treatment, that's worth a conversation.
Tell me what you're working with and what decisions it should help you make.
Book a call →This site uses cookies to understand how visitors use it (Google Analytics). See the Privacy Policy for details.