Sales Analytics & Customer Segmentation
Consolidating five branches of scattered spreadsheets into one live Power BI model with real customer segmentation for Faragir Sanat Mehrbin.
Client
Faragir Sanat Mehrbin
Role
Data Analyst
Timeline
Data period 2018-2020
Deliverables
SQL data model + Power BI dashboard suite
+22% repeat purchases
Daily self-serve insights
Unified sales view
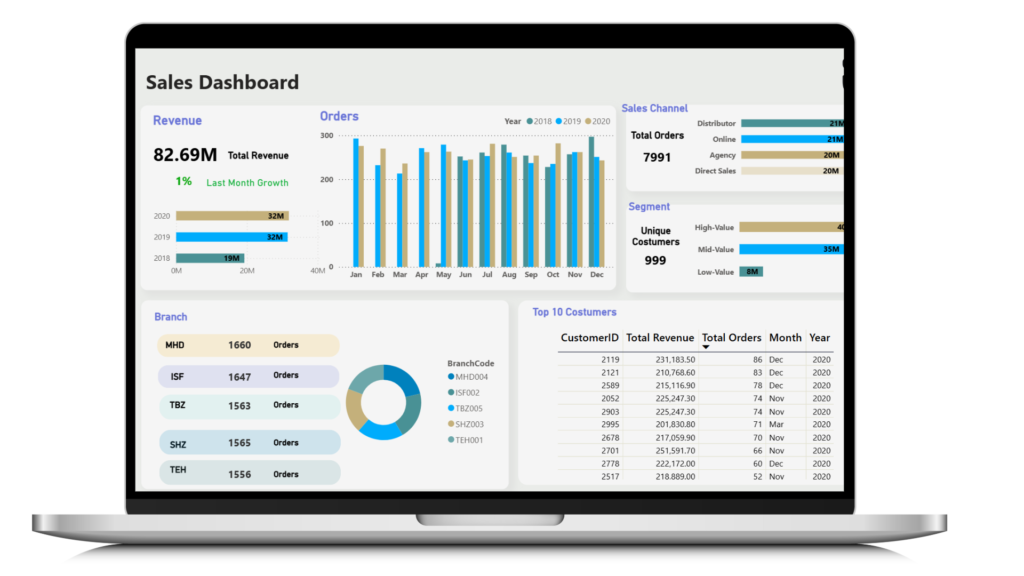
Faragir Sanat Mehrbin was running five branches (MHD, ISF, TBZ, SHZ and TEH) on manually assembled weekly spreadsheets — each with its own version of “the numbers,” no shared customer segmentation, and no way to see trends across the full 2018-2020 period without rebuilding a report from scratch. Total revenue across the period was substantial (over 80 million), but almost none of it was visible in one place at once.
The goal was a single Power BI environment that replaced the exports entirely and gave every branch the same live source of truth.
Auditing what “reporting” actually meant
Before writing a line of SQL, I mapped how each branch currently reported: different date formats, inconsistent customer IDs, and duplicate rows from re-exported spreadsheets. This informed exactly which cleaning rules the SQL layer needed to enforce.
Deciding what “valuable” meant for this business
Rather than just charting revenue, I worked out an RFM-style segmentation (Recency, Frequency, Monetary) that classified the 999 unique customers into High, Mid and Low-Value tiers — the basis for every filter in the finished dashboard.
SQL as the single source of truth
All cleaning (standardised dates, de-duplication, unified branch keys) happened once in SQL, not repeatedly inside Power BI or Excel, so every report pulled from the same clean base.
A slide-out filter panel over five separate reports
Instead of building one dashboard per branch, a single model with a slide-out filter (Year, Month, Branch, Channel, Segment, Customer) let any branch manager isolate their own view without needing five different files.
Results
- Team gained a single source of truth across all five branches
- Reporting shifted from manual weekly exports to live, daily dashboards
- +22% repeat purchases, faster decisions, daily insights
Reflections
Most of the value here came before the dashboard existed — in the SQL cleaning rules and the decision to segment customers by value rather than just by branch. Once that foundation was right, the Power BI layer was almost the easy part.
One clean source beats five spreadsheets
Consolidating three years of branch-level exports into a single SQL model eliminated the version-conflicts that came with everyone keeping their own copy.
Segment first, then dashboard
Building RFM-style High/Mid/Low-Value segments across 999 unique customers before designing any chart, so the visuals reported a segmentation model rather than just totals.
Self-serve, not scheduled
A slide-out filter panel (Year, Month, Branch, Channel, Segment, Customer) so branch managers could answer their own questions instead of waiting on a weekly export.
Consolidating three years of data
Procurement, order, and branch-level sales exports spanning 2018-2020 were joined and cleaned in SQL: fixing inconsistent date formats, removing duplicate transactions, and standardising branch codes across five locations (MHD, ISF, TBZ, SHZ, TEH).
Modelling customers, not just orders
DAX measures built RFM-style segmentation across 999 unique customers into High, Mid and Low-Value tiers, alongside branch and channel breakdowns (Distributor, Online, Agency, Direct Sales) and a Top-10 customers table.
Designing for daily use
A slide-out filter panel across Year, Month, Branch, Channel, Segment and Customer let staff drill into their own numbers, rather than needing a report re-run for them.
Replacing exports with live dashboards
The finished dashboard replaced the manual weekly export process entirely, so the same numbers everyone saw were always current.
Interested in a similar engagement? Get in touch — I'm available for new SEO and analytics projects.