Google Trends Dashboard
How a single Power BI dashboard turned scattered Google Trends data into a weekly content and ad-spend decision tool for Palik (UK).
Client
Palik (UK)
Role
BI Developer & Data Analyst
Deliverables
Power BI dashboard (3 views) + refresh workflow
+40% SEO opportunity
−20% paid waste
Live demand signal
Palik (UK) is a footwear and fashion retailer that had been planning content calendars and ad spend largely on instinct — reacting to what felt popular rather than what search data actually showed. There was no single view of which product terms (from “handmade shoes” to “men’s wedding shoes”) were actually gaining traction, so budget and publishing decisions lagged the market rather than leading it.
The brief was straightforward in intent but not in execution: turn twenty years of Google Trends history into something a marketing team could check every week and trust enough to act on.
Where the guesswork was coming from
Before building anything, I audited how the team was actually making decisions: pulling one-off Google Trends screenshots, comparing them by eye, and rarely revisiting them once a campaign launched. There was no shared source of truth, so two people often argued about the same trend using different exported charts.
Choosing Power BI over spreadsheets
Given the need for repeat weekly use, a live-connected dashboard made more sense than a static export. Power BI’s Power Query layer let the trends data be pulled and normalised automatically rather than being rebuilt from scratch every time.
Indexing instead of raw counts
The biggest early decision was to normalise every keyword to a 0-100 index scoped by topic and country. Without it, a high-volume generic term would always dwarf a smaller but faster-growing niche term, hiding exactly the signal the team needed.
Splitting the dashboard by decision, not by data
Instead of one page with every filter, the dashboard was split into three views matching three real questions the team asked: what’s rising right now, what’s the long-term seasonal pattern, and what happened in just the last week.
Results
- Calendars aligned to rising demand instead of gut feel
- Budgets moved toward markets and terms showing real momentum
- +40% SEO opportunity surfaced, −20% paid spend wasted, faster weekly planning
Reflections
The lesson from this project wasn’t really about Power BI — it was that a demand signal only gets used if it’s trusted. Making the refresh time visible and keeping the filters consistent across views mattered as much to adoption as the DAX modelling underneath it.
Normalise, don't compare raw volume
Comparing raw search counts across keywords like "handmade shoes" vs "men dress shoes" is misleading; indexing 0-100 by topic and country made trends genuinely comparable.
Three views beat one dense screen
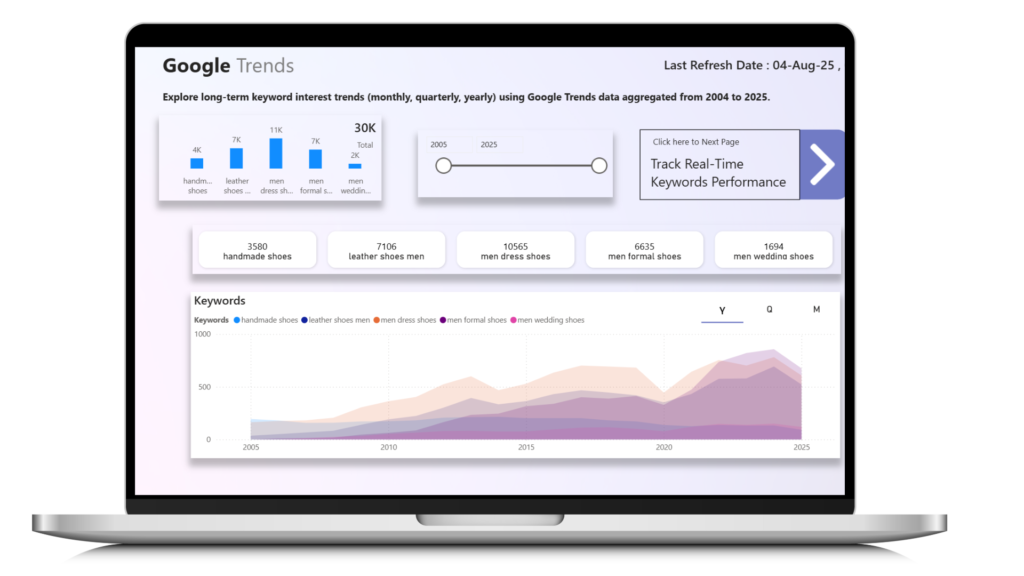
Splitting into Top & Rising, Long-Term (2004-2025), and Last 7 Days meant each stakeholder question had its own dedicated view instead of one overloaded page.
Trustworthy by design
A visible "Last Refresh" timestamp and consistent filters across views so the team could rely on the numbers in a live planning meeting, not just as an exported report.
Connecting and normalising the data
Google Trends pulled into Power BI via Power Query, indexed 0-100 by topic and country so keywords in different categories, like footwear styles, could be benchmarked on the same scale.
Building the demand model
DAX measures for Top & Rising terms, year-over-year deltas, and rolling 7-day aggregations turned raw interest scores into an actual signal for what was gaining or losing momentum.
Designing for three decisions
Rather than one dashboard trying to answer everything: a long-term view (2004-2025) for seasonal planning, a rising-terms view for near-term content, and a 7-day view for reactive ad adjustments.
Operationalising it
A visible "Last Refresh" timestamp and locked filter logic so the dashboard could be trusted and reused week after week without a walkthrough each time.
Interested in a similar engagement? Get in touch — I'm available for new SEO and analytics projects.